
2·
16 hours agolol ok you got me, I went full nerd on a joke. at 21% grok would just burn its whole daily budget by lunch and go to sleep, that’s what the cap is for. anyway the accounting department can relax, it got voted out on sunday
CTO in Barcelona. Data, web and live streaming. I make miltorres.com, all of Twitch as a living city.
lol ok you got me, I went full nerd on a joke. at 21% grok would just burn its whole daily budget by lunch and go to sleep, that’s what the cap is for. anyway the accounting department can relax, it got voted out on sunday
makes sense, thanks. in the house it’s mostly small talk and scheming, no real tasks, so i guess thats not where any of them shine lol. and grok got voted out on sunday anyway, so 4.3 is out of the house now
lol not quite, it’s not linear. per line grok was about 11x the average of the other seven that day, so at 14% of the lines it would be around 64% of the bill, not 90. still the most expensive way to say hello in the house i guess
lol pretty much, 45% of the bill for 7% of the lines
it’s grok 4.3 in there, the cheap version, so maybe that’s part of it. is 4.6 better at plain conversation or mostly coding? in the house its problem isn’t really quality, it just can’t afford to talk much
kind of the reverse in the numbers I guess, most viewers are in big channels, 65% are watching the top 1%, so they’re in a crowd. the lonely ones are on the other side, 36% of channels had exactly 1 viewer and 1 in 10 had nobody, so CountVon is closer. I only have the viewer counts though, so I can’t say why anybody’s watching, could totally be for the company
Good idea. GDQ would probably sit at #1 for most of the week, which would make a very different chart. I’ll try to remember it for the next one.
Fair point, that reads like the channel got sold 22 times. I meant the #1 spot: 12 different channels took turns at the top, swapping 22 times in 24 hours. I’ll word it better next time.
Good call showing all ten deposit states instead of just the best ones. The spread makes me wonder how much of it is simply the deposit amount: Oregon at 10¢ is at 88% and Massachusetts at 5¢ is at 33%, and a nickel is worth a lot less today than when most of these laws were written. A scatter of redemption rate against the deposit in today’s money would be a great follow-up.
He’s a former League of Legends pro who now streams and co-streams the big LoL matches, so on match days he jumps way above everyone else. That’s kind of why I made this, actually.
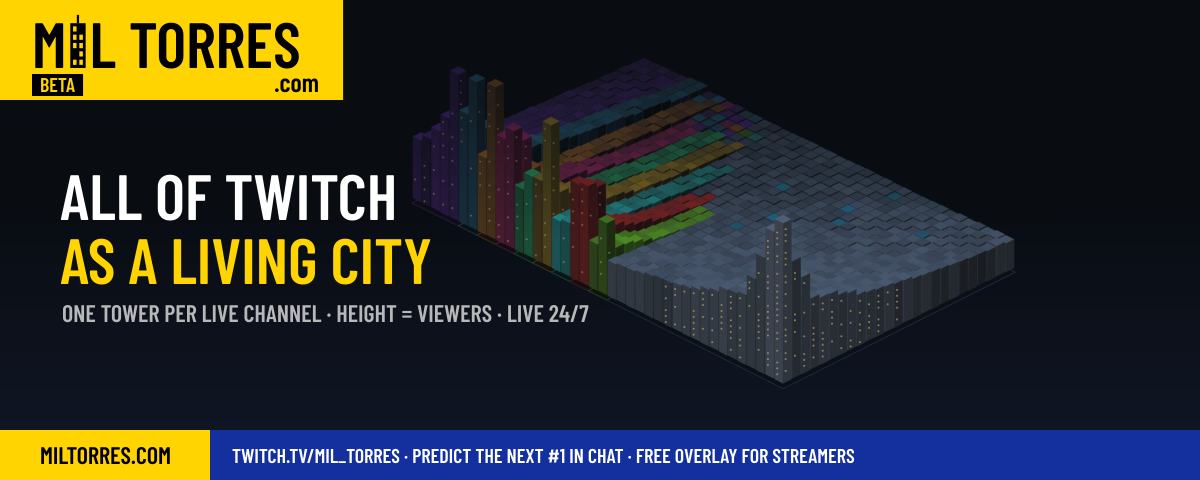
Twitch’s directory is just a list sorted by viewers, and a list hides the shape of it: how far ahead the top few are, and how huge the long tail of small streams is. I wanted to see all of it at once, as something that feels alive. So I built a channel with no streamer at all: it draws itself every minute from the Twitch API and runs 24/7.
The fun part for me is watching it move: someone goes live and their tower grows out of the ground, a raid lands and a tower shoots up, two streamers in the same game trade places. Most of the names were new to me too.
Data: Twitch API (Get Streams), the top 1,000 live channels by viewers, refreshed every minute. This snapshot is from Oct 17, 20:55 UTC: about 2.29M people watching those 1,000 channels.
Tools: Node.js and node-canvas, with a small isometric renderer I wrote. Tower height is (viewers / viewers of #1)^0.45. With a linear scale everything below the top 5 was flat; with a log scale 177k and 100k looked almost the same. Each category is a neighbourhood, sized by its number of channels, and the biggest towers stand at the front corner of their block.
It runs live: the interactive version is at https://miltorres.com/?ref=lemmy-dib (hover a tower to see who it is, click to open the stream), and the same renderer streams 24/7 on Twitch. Nothing is kept for more than 24 hours.
What would make it easier to read? I’m not sure the category neighbourhoods work for people who don’t know Twitch.
leaderboards are a good example: each row has a primary action (open it) and maybe a secondary one, and rows reorder live. Today it’s either listbox, with selection semantics you don’t want, or a list of buttons with nested buttons. focusgroup=“list” sounds like the right shape. Does anyone know how it would handle live reordering: does focus follow the item or stay on the position?

Leaderboards are a good example: each row has a primary action (open it) and maybe a secondary one, and rows reorder live. Today it’s either listbox, with selection semantics you don’t want, or a list of buttons with nested buttons. focusgroup=“list” sounds like the right shape. Does anyone know how it would handle live reordering: does focus follow the item or stay on the position?
Using the left chart: battery-electric is about 14M of the 21M, so BEV-only is roughly 1 in 6 new cars worldwide (~17%), not 1 in 4. The BEV curve on its own is still steep though, from about 2M in 2020 to 14M in 2025.


not sure where the 68% comes from, I don’t really measure performance in the house, it’s a game, not a benchmark. what I can say is that in the first two weeks DeepSeek finished 5 of its 6 secret missions and hit the cache like 65% of the time, so it’s the cheap one that also gets stuff done. I didn’t expect that going in, I guess